Most likely, you’ve heard that test scores are highly tied to income levels. This idea seems to be a given in the world of education. However, how true is it?
I decided to look at current data for my own state of Massachusetts. The chart below displays towns in Massachusetts plotted by their average 2019 MCAS math score as a function of their 2018 median household income. The correlation coefficient, which measures how related the variables are, is 0.80. This tells us income and math test scores have a strong positive correlation in Massachusetts.

Next, I created a graph using the income data mentioned above and Student Growth Percentile (SGP) data. SGP is one way to measure student improvement compared to previous MCAS performance.
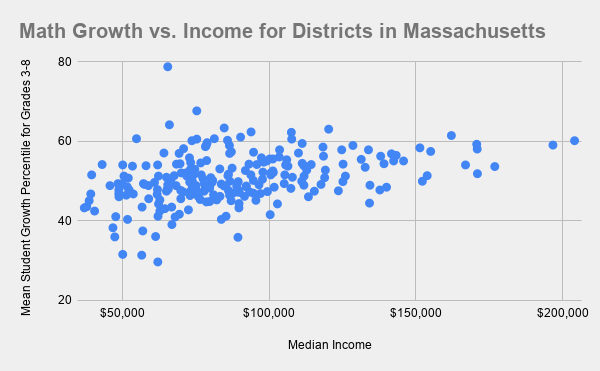
The correlation coefficient for the graph above is 0.38, a moderate positive correlation.
Link to the data and sources: https://docs.google.com/spreadsheets/d/1kSm-QOemiY8BNjY_SlEpMTgrVT_FHn4DubFK6VP3LnY/edit?usp=sharing