Black Lives Matter

According to School and District Profles, African American students in Massachusetts make up 9.2% of the state’s public school student body. I was curious about the distribution, family income, and achievement of these students across the Commonwealth. I decided to use income and MCAS data compiled last year alongside newly-collected percentages of African American students for each district to look into this further. Below are my findings.

When looking at over 200 separate districts in the state, the average percentage of African American students per district in Massachusetts is 4.5%. Since 9.2% of all students are African American, this means that the distribution is skewed across the state. In reality, about half of all districts in the state have less than 2.6% African American students. Notably, seven districts have exactly 0% African American students (Leverett, Petersham, Plympton, Rowe, Shutesbury, Westhampton, and Worthington.)

Where, then, are most of our African American students? Here’s a list of the top 10 districts:

Brockton, 60%
Randolph, 50%
Avon, Boston, 30%
Provincetown, 26%
Stoughton, 24%
Cambridge, 23%
Holbrook, 22%
Springfield, Malden, 19%

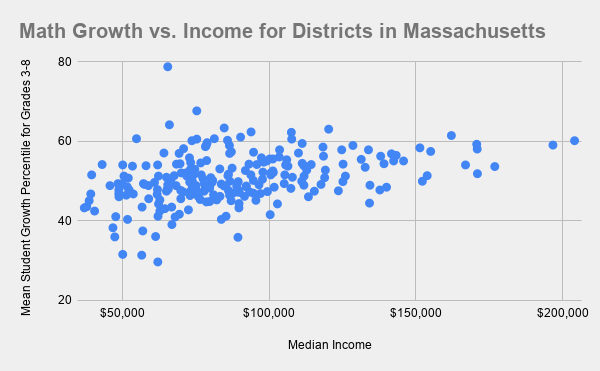
Looking at the income and MCAS data we also find:

  • The average income of the top 10 districts listed above is $63,658 while the average income of all Massachusetts districts is $88,319.

  • The average mean math score of the top 10 districts listed above is 493 while the average mean math score of all Massachusetts districts is 501.

Notable exceptions to the bullet points above: the districts of Cambridge and Milton consist of both above-average percentages of African American students as well as above-average income and test scores.

With the long-overdue spotlight on the plight of African Americans, I wanted to highlight the extremely uneven distribution of our African American students here in Massachusetts. This impacts both the African American students and their White peers, many of whom are growing up in districts with shockingly low numbers of African American students.

Data and sources found here.

Thinking Isn't Always Learning

I follow Doug Lemov on a few social media platforms. As the author of Teach Like a Champion, Lemov is both respected and disdained in the education world. Teach Like a Champion focuses on the science of teaching, leaving out much of the art of teaching to the disappointment of some. I, however, enjoyed his book for its actionable advice. Another issue some have with Lemov is his support of charter schools, but that’s for another blogpost.

Recently, Lemov posted On Thinking and Learning. It’s not very long and I encourage you to read it. The post struck me for a few reasons:

  • It differentiates between thinking and learning,

  • It reminds the reader of the benefit of background knowledge and…

  • It illustrates the importance of retrieval techniques with a relatable example.

The example mentioned in the last bullet point really resonated with me. Lemov explains that although he has read many books, he cannot remember much of them. This is true in my own life and I suspect in the lives of many. I find myself scanning my bookshelves and knowing I have read many of the books I see, but often unsure of even their most basic ideas. Lemov goes on to explain that he now keeps a journal of book quotations for later review. Although I do not keep a journal, I mark up the books I read, underlining and starring key ideas or striking sentences. One of these days, I will help myself learn what I once read and thought about by going back and rereading those highlights.

Student Work in the Time of Covid-19

Hello reader,

Since my last post, I’ve been “teaching” students from my couch and kitchen counter. It doesn’t feel like teaching anymore. I haven’t taught new material (per district-union agreement) and have found it difficult to check in with students. Also, I’ve cut the workload down to at least half (again, per district-union agreement).

I’ve been keeping track of student work, of course. For those who haven’t been completing much or any of the work I’ve assigned, I’ve emailed or called home. I’ve also spoken to our guidance counselors and principal when I believe they should reach out to students or parents.

Here’s where student work completion stands for me today:

My Students' Work Completion For The First Five Weeks of Distance Education.png

I’m not sure if this is the norm for my school, district, or on an even broader scale. I’m not sure how many of my students have regular access to a computer or a quiet place at home. What I do know is that this amount of work completion is far less than when students are in my classroom. Many teachers I’ve spoken to have also seen work completion drop. Some seem very worried (“They’ll never catch up”), others are more optimistic (“They’ll be fine”). I’m not quite ready to make predictions for the long-term. For now, I’m simply making observations.

Big deal or not so much, what do you think?

Learning in the Time of Covid-19

What a difference a month makes. I published my last post from Miami during February break and today, about a month later, I’m publishing this post from my apartment where I’ve been for most of the last week or so due to the Covid-19 pandemic.

School is closed for at least three weeks and I, along with many other teachers across the country, am doing my best to provide my students with assignments from a distance. In my district of Medford, Massachusetts, teachers were told to post what we can. Our administration knows that we had very little time to prepare for this long closure and are not pushing us to continue with our regular assignment workload. It is much appreciated.

But all of this distance learning has got me thinking about Massive Open Online Courses (MOOCs). MOOCs provide anyone with access to the internet a structured way to learn almost anything. Courses range from mathematics to art to history to cooking and more. Popular MOOC sites include Khan Academy, Courseva, and EdX.

MOOCs, however, have not lived up to their initial hype. Why? Here are some reasons outlined in two articles:

  • Very low completion rate (just 3-10%!) and low retention rates

  • A non-dynamic format with no exchange of ideas as typically available in a classroom

  • No live instructor to give feedback or encouragement

Having completed a MOOC myself, I am not surprised with these points. In the fall of 2019, I completed a MOOC through HarvardX, one of the schools available through EdX. The course focused on quantitative analysis and I was very much looking forward to expanding my knowledge in this area after having completed quantitative statistical analysis for my dissertation. The MOOC, however, was tough to get through. I often felt frustrated that I could not ask questions. I also felt alone in the course without a classroom of peers or even an online group to connect with. I successfully completed the course but don’t plan on signing up for another anytime soon.

As I post assignments on Google Classroom for my middle school students this first week of Covid-19 school closures, I hope their experience with my assignments isn’t as frustrating as my experience with EdX. For one, my students know I am only an email away and I hope that helps.

The future of MOOCs is uncertain. Their lack of success over the past decade speaks to the importance of real classrooms and real teachers.

Sources:

  1. https://www.insidehighered.com/digital-learning/article/2019/01/16/study-offers-data-show-moocs-didnt-achieve-their-goals

  2. https://www.wired.com/insights/2014/08/whats-wrong-moocs-arent-changing-game-education/

School Vacation Week

I’m writing this post from Miami where I’m soaking up every possible ray of sun. This was a last-minute trip. I’m lucky that my father retired here, but I also knew that I should probably work on recharging this week. Once I saw that I could book a flight for less than $300, I couldn’t reserve my seat fast enough.

Recharging for me this week involves laying by the pool but also reflecting on the school year thus far. I enjoy what I do, and I enjoy thinking about it. I am now thinking about all of my thinking, though. It seems I’ve developed a pattern for school vacation weeks, specifically Christmas/New Year’s break, February break, and April break. It goes something like this:

  • Leading to time off: I’m excited for the opportunity to sleep in, to wake up slow, to wear whatever I want, to workout whenever I want to, and to reflect on my classroom practices. I sometimes start a list of items to adjust or realign. This time around, for example, I planned on going through some student surveys so I could gather data on what my current students like and dislike about my class.

  • During vacation: I catch up on sleep, but I also spend too much time on social media. This kind of mindless activity is necessary, I know. I can’t always be working. I shouldn’t always be working. Still, I can’t help but feel like I’m wasting time when I’m not being productive. I typically end up in a coffeeshop at least a few days during vacation.

  • Post-break: I return to work refreshed and ready to rock it in my classroom. I may try to implement slight improvements to my teaching or classroom routines, but it’s never quite the amazing, over-the-top adjustments I had envisioned prior to and during my time off. Here again, I realize this is probably normal. “Don’t be so hard on yourself,” I think. Sometimes I even listen.

Who can relate?

Carolina

IMG-0446.jpg

A Memory - Part I

The sticky summer dirt is easily ignored by children with one focus. Worry free and full of energy, we just wanted to play. Steven and I made our way from my apartment building on Union Street to the familiar Getty Gas Station a few bikeride minutes away. I was about ten years old and Steven about seven. We had effectively grown up as so-called cousins ever since our mothers immigrated to the United States from the Dominican Republic in 1986. Steven had not been born yet. While we grew up in neighboring towns, our mothers would often visit each other and their children, myself, Steven, my sister, and his sister, would play and play as children do.

On this particular day, it was just me and Steven. When we arrived at the Getty, I decided to purchase a soda from the vending machine just outside the entrance. One at a time, I placed my coins in the vending machine, watching the counter display my cumulative deposit. When I ran out of coins I pressed the big rectangular button with the label depicting the drink I desired. But no soda can. I pressed the button again and again. Nothing and nothing. The cashier came out of the Getty and I mentioned that I had deposited the required total but nothing came out of the machine. I knew it was a lie, but I figured it was harmless. Steven silently watched the scene unfold. Kind as he was, the cashier added a few more coins, pressed the button, and handed me the soda he knew I wanted. 

Later in the day, when Steven and I were back on Union Street, I was startled to hear my mother angrily calling my name. Her rage placed a particular fear in me, a fear developed through the time-honored Dominican custom of belting children as needed. She walked up to me and communicated her utter disgust with my scam, and I immediately realized that Steven had decided to clear his conscience. Steven had a deep sense of right and wrong even at his young age, or maybe because of it. He had witnessed my lie and the result of that lie: his cousin walking away with something for which she did not fully pay. It had bothered him all the way home. 

Decades later, I would return to this memory often. A memory that stands in sharp contrast to the present day - for both me and Steven - and one that would create more questions than answers in my mind.

Mass. Math Scores vs. Income

Most likely, you’ve heard that test scores are highly tied to income levels. This idea seems to be a given in the world of education. However, how true is it? 

I decided to look at current data for my own state of Massachusetts. The chart below displays towns in Massachusetts plotted by their average 2019 MCAS math score as a function of their 2018 median household income. The correlation coefficient, which measures how related the variables are, is 0.80. This tells us income and math test scores have a strong positive correlation in Massachusetts.

Math Score vs. Income for Districts in Massachusetts.png

Next, I created a graph using the income data mentioned above and Student Growth Percentile (SGP) data. SGP is one way to measure student improvement compared to previous MCAS performance.

Math Growth vs. Income for Districts in Massachusetts.png

The correlation coefficient for the graph above is 0.38, a moderate positive correlation.

Link to the data and sources: https://docs.google.com/spreadsheets/d/1kSm-QOemiY8BNjY_SlEpMTgrVT_FHn4DubFK6VP3LnY/edit?usp=sharing


Results of My Research

Hi reader,

It’s been a while since I’ve updated this blog. I’ve been busy with my Ed.D. program, but I’m now finally done with all the work! I only need to present my findings next weekend to fully earn that diploma. Below is a summary of my findings for those who are interested.

In Medford, Massachusetts' middle school students…

  • Positive attitudes toward math are higher in 6th graders than in 7th graders and higher in 7th graders than in 8th graders, with a significant difference between the latter two.

  • Attitudes toward math tend to be similar between males and females, with the exception of math anxiety which is higher in females.

  • Students in the accelerated/advanced math classes report more positive attitudes toward math, with the exception of value (how important they perceive math to be for their futures).

  • Asian students reported the highest levels of positive attitudes toward math and Hispanic/Latinx students reported the lowest. Black and White students were somewhere in the middle. This trend, however, was not true for math anxiety where no significant differences were found among the races.

  • Of the factors studied, self-efficacy/self-concept correlated strongly and positively with achievement in math. Other factors such as value of math and enjoyment of math correlated weakly with achievement.

  • Income did not correlate with any of the attitude factors studied. This might be because reliable income data was not available.

  • There was a strong positive correlation between enjoyment of math and self-efficacy/self-concept beliefs in math. That is, students who enjoy math are likely to also believe they can be successful in math and vice-versa.

My presentation slides, which include much more detail on the bullets above, can be found here. I’m also happy to share my dissertation through email.

Carolina Vila

Introducing Gerrymandering in Class

I attended a gerrymandering conference last summer. It was thought-provoking, eye-opening, and overall the best conference I've ever been to. Created by Tufts professors, the Geometry of Redistricting workshop invited hundreds of educators, computer scientists, lawyers, and other professionals from around the country to learn about and brainstorm solutions to the complicated issue of gerrymandering. According to Merriam-Webster, to gerrymander is "to divide (a territorial unit) into election districts to give one political party an electoral majority in a large number of districts while concentrating the voting strength of the opposition in as few districts as possible." In short, the way you divide land can determine the winner of an election. Because the gerrymander-er is working with dividing pieces of maps, they are working with math, and as an educator at the gerrymandering conference I was encouraged to bring what I had learned back to my classroom.

At some point during the last two days of the conference, facilitators asked me and other participants to gerrymander a ten-by-ten grid as a sort of warm-up exercise. Using something similar with my students seemed like a no-brainer - it was simple, fun, and enlightening. Below is the activity I eventually used with one of my classes (on the last period of a Friday!)

1. Before diving into a ten-by-ten grid, I started with a simpler one. I gave each student a sheet with three ten-by-five grids with the first two columns filled with x's (as pictured below). I asked students to divide the first grid into five equal sections so that 3/5 of the sections are dominated by blank blocks while the other 2/5 of the sections are dominated by x blocks. If these were voting districts, it would seem that dividing the blocks up in this way would be "fair" (the majority of districts are dominated by the majority group with perfect proportionality).

IMG-0170.JPG

2. For the second grid, I asked my students to divide the fifty blocks into five equal sections in which all of the sections have more blank blocks than x blocks. This sounds a bit confusing at first (to mostly anyone, I think) and I had to repeat the direction a few different times in slightly different ways. After a minute or two, though, most students were able to figure out that simply dividing the sections in their horizontal rows two at a time does the job. This can be seen in the second grid of the picture above: Each section is now dominated by blank blocks.  If these were voting districts, the blanks would have control of all the districts.  As you might expect, students believed this set up to be very unfair.

3. For the third grid, I asked students to divide the fifty blocks into five equal sections so that a majority of sections have a majority x blocks.  In the third grid of the picture above, you can see that 3/5 of the sections are dominated by x blocks.  Now, the minority controlled the majority of the districts. Students thought this was unfair but also "cool." There's something fun about helping the underdog win.

4. I expanded on the third grid at this point in class. When, if ever, should the minority control most of the districts? Who actually does this with maps? (Answer: both major political parties in the United States have gerrymandered.) Which real districts are gerrymandered? What do they look like? How do people feel about it? What, if anything, is being done about it?

5. After a lively discussion and looking at real gerrymandered districts with the help of the internet, I gave students another sheet. This time the sheet had two ten-by-ten grids with x's in 40 of the 100 blocks. This exact arrangement of x's was taken from the activity facilitated at the Tufts conference. I asked my students to divide the 100 blocks into ten equal sections so that (1) on one grid the majority of sections were dominated by blank blocks and (2) on the other grid the majority of sections were dominated by the x blocks. Pictured below is one work in progress, mistakes included.

IMG-0178.JPG
IMG-0177.JPG

6. Once mistakes were cleared up, students were very excited to show off their gerrymandered maps. I shared different arrangements from student volunteers using my document camera and we talked about strategy in performing the act of gerrymandering. For example, students shared how they were able to concentrate a large number of the dominant group in fewer sections by packing them together. This gives the minority group a chance to spread themselves over more districts, an actual gerrymandering technique that's called "cracking and packing."

7. I closed the lesson with a reminder that because real districts don't exist in perfect square blocks, the math and computer science behind redistricting is immensely more complicated. I also reminded my students that this is an ongoing issue/problem, and one to which we will return as more and more articles come out about gerrymandering. 

Update: the issue of gerrymandering came up in the recent Alabama senate race between Doug Jones and Roy Moore. Although Doug Jones won the majority of votes, had the race been decided by district votes Moore would have won 6 to 1!

If you teach, I hope you'll considering facilitating a similar lesson soon. Students loved it.

Carolina Vila